Logging and Events
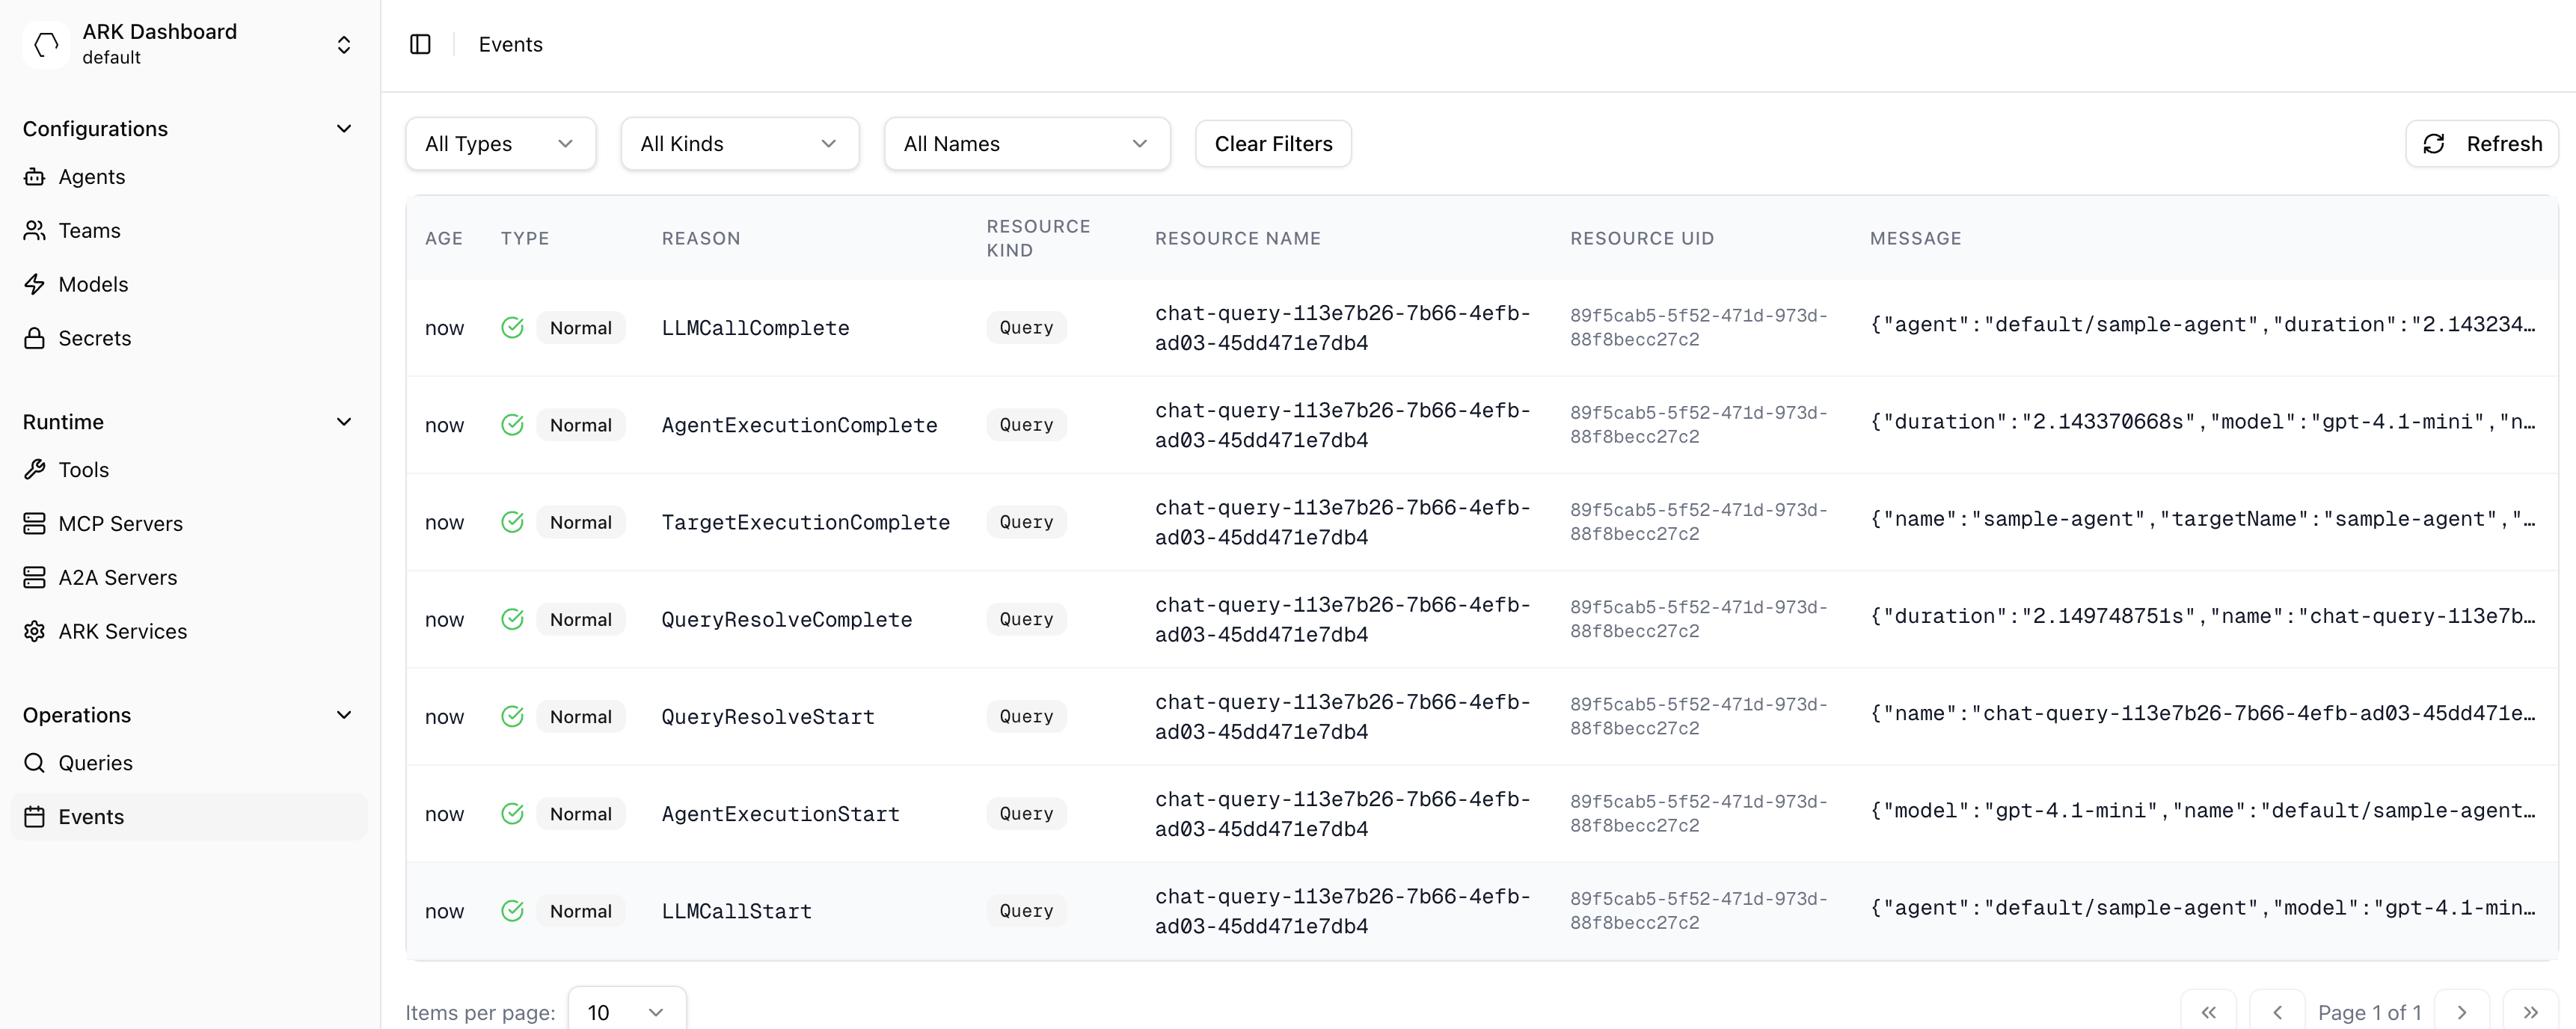
Ark diagnostics and informational logging is handled in two ways; either via direct logging in the code or raising events. The ‘Events’ page on the dashboard can be used to view and filter events:
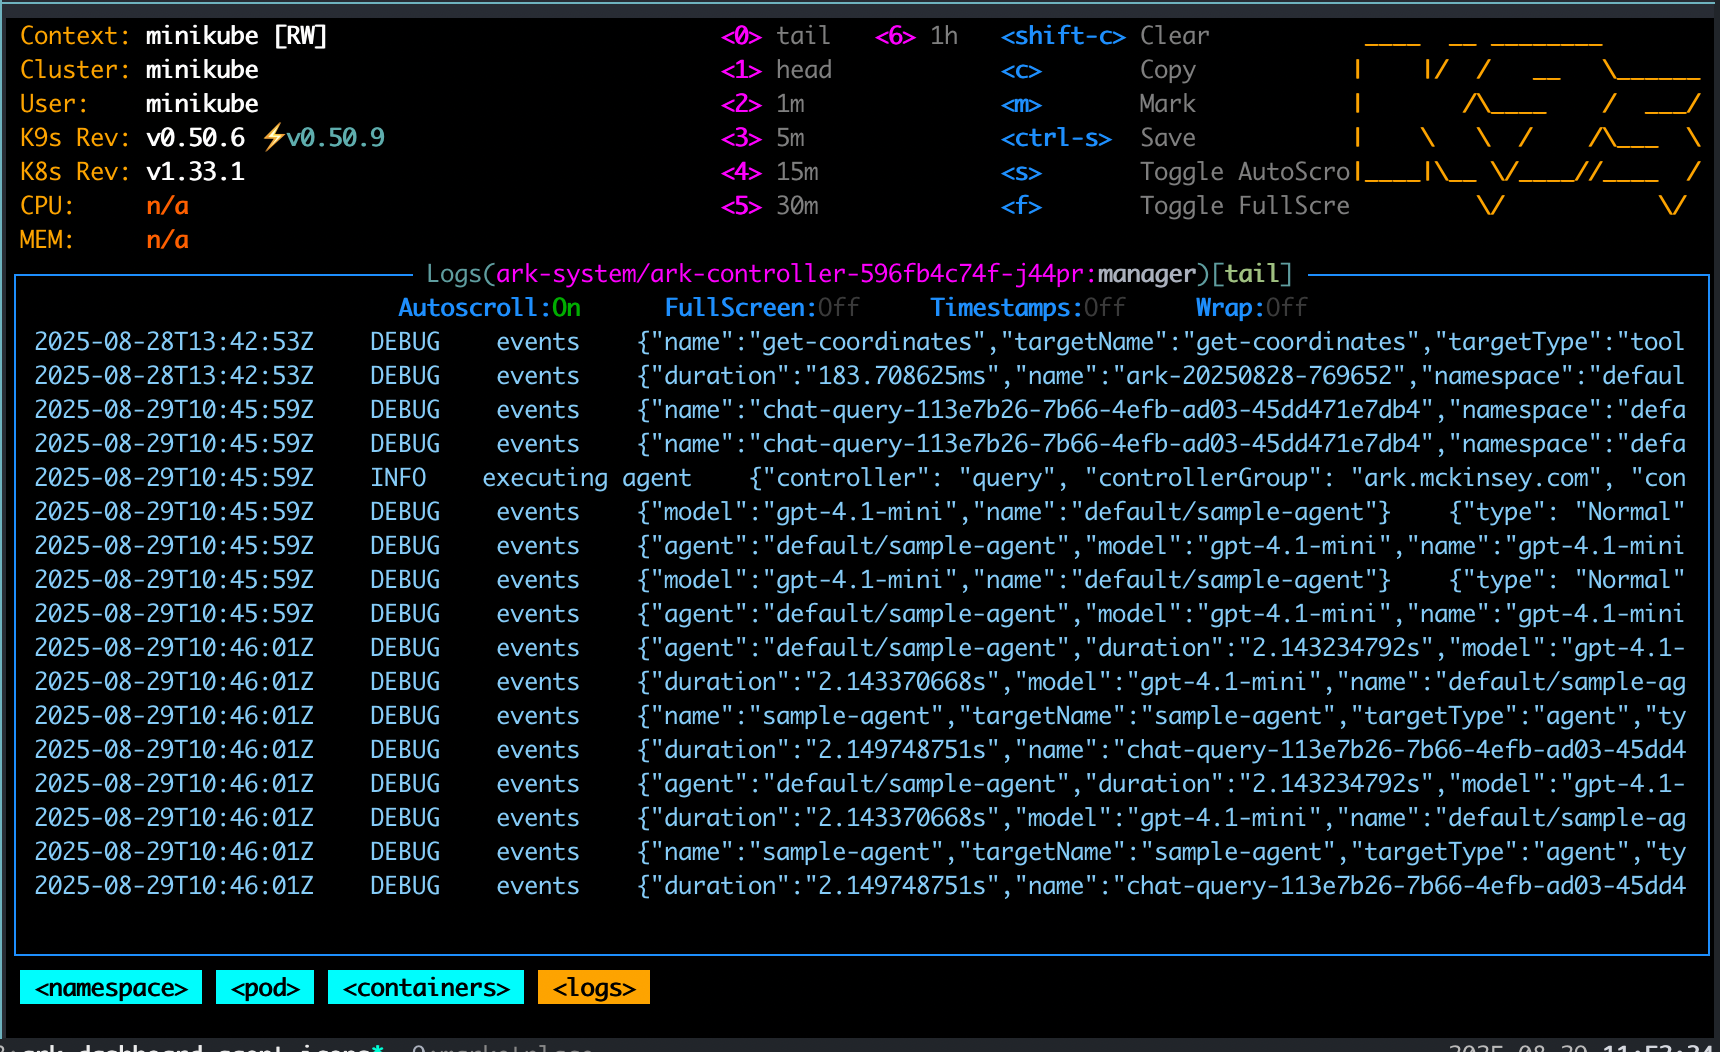
And logs can be viewed in a number of ways, for example via k9s:
This guide covers how to view events and logs and best practices for raising events and log messages.
Viewing Events
You can view events via kubectl:
# Show events for a specific resource
kubectl describe query my-query

# Show all events in namespace
kubectl get events --sort-by='.lastTimestamp'

# Show events for specific resource type
kubectl get events --field-selector involvedObject.kind=Query

# Show structured event data from annotations
kubectl get events --field-selector involvedObject.kind=Query -o json | jq -r '.items[] | select(.metadata.annotations."ark.mckinsey.com/event-data") | {reason: .reason, data: (.metadata.annotations."ark.mckinsey.com/event-data" | fromjson)}'

# Filter by specific event type
kubectl get events --field-selector reason=QueryExecutionComplete
You can also view events in k9s with the :events command:
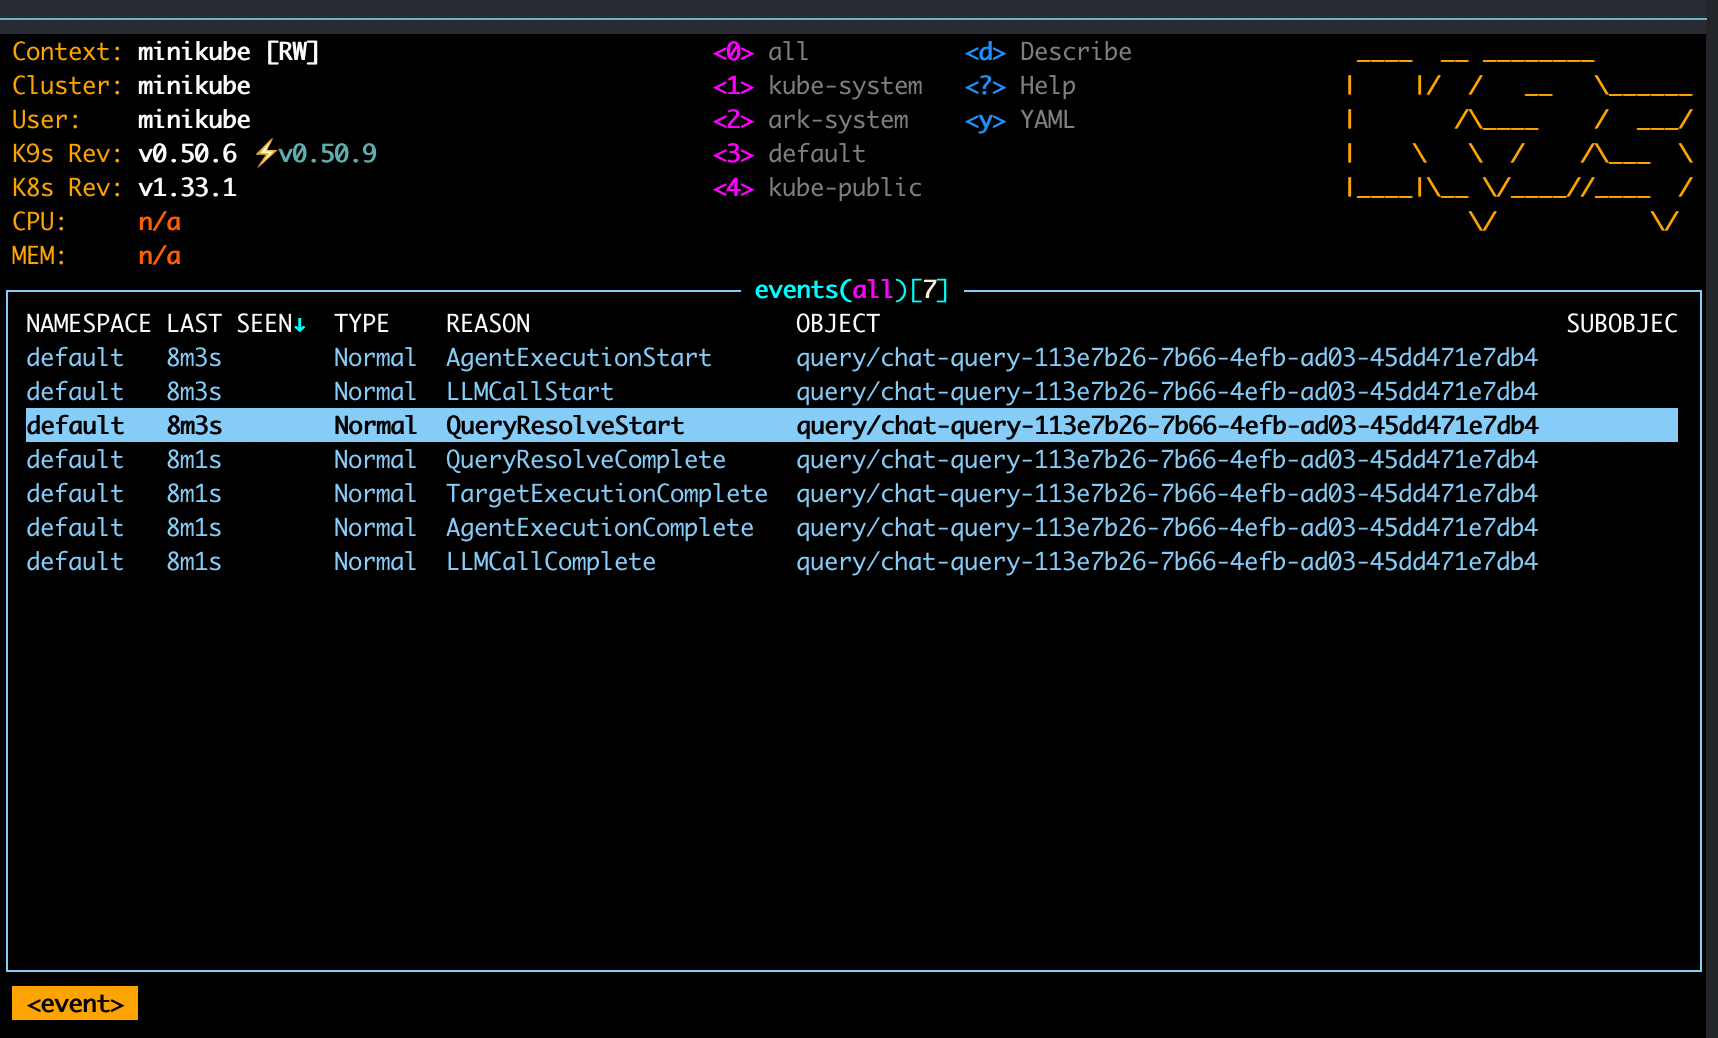
And finally, events can be seen in the Events page in the Ark Dashboard.
Viewing Logs
View the controller logs with:
# Controller logs
kubectl logs -f deployment/ark-controller -n ark-system
Use the --follow parameter to tail logs. You can also view logs in k9s by going to the ark-controller pod in the ark-system namespace. There are many options to wrap, search, copy, etc. Use k9s and choose :namespace then ark-system and select the ark-controller pod:
Event and Logging Guidelines
Use events for:
- User-facing information visible in
kubectl describe - State transitions and lifecycle events
- Successful completion of significant operations
- Error reporting that application owners need to see
As an example, query execution emits these events following the {Operation}{State} pattern:
Normal/QueryExecutionStart: Query begins executionNormal/AgentExecutionStart: Agent begins executionNormal/ToolCallStart: Tool invocation beginsNormal/ToolCallComplete: Tool invocation completes with duration and resultsNormal/LLMCallComplete: LLM call completes with token usage detailsNormal/AgentExecutionComplete: Agent execution completes with durationNormal/QueryExecutionComplete: Query execution completes
All events with structured data store it in the ark.mckinsey.com/event-data annotation as JSON.
Use Logging For:
- Internal debugging and troubleshooting
- Detailed operational information
- Development insights
- Expected failures (log as INFO, not ERROR)
As an example, controllers log operational details:
log.Info("Memory processed successfully", "memory", memory.Name, "address", resolvedAddress)
log.Error(err, "failed to resolve ExecutionEngine address", "executionEngine", executionEngine.Name)

// Expected failures like probe failures are INFO, not ERROR
log.Info("model probe failed", "model", model.Name, "status", errorMessage)
How to log events
The new eventing system uses specialized recorders from the eventing package. Each resource type has a dedicated recorder:
import (
    "mckinsey.com/ark/internal/eventing"
)

// In controller setup
r.Eventing = eventing.NewRecorders(eventEmitter)

// In reconciler - use operation recorders with Start/Complete/Fail pattern
ctx = r.Eventing.QueryRecorder().Start(ctx, "QueryExecution", "Executing query", nil)

// On success
r.Eventing.QueryRecorder().Complete(ctx, "QueryExecution", "Query execution completed", operationData)

// On failure
r.Eventing.QueryRecorder().Fail(ctx, "QueryExecution", "Query execution failed", err, nil)
The recorders automatically:
- Track timing and duration
- Add structured metadata to annotations (
ark.mckinsey.com/event-data) - Follow consistent naming patterns (
{Operation}Start,{Operation}Complete,{Operation}Error) - Include operation context (queryId, sessionId, namespace, etc.)
Stable Messages for Conditions and Events
Event and condition messages must be simple strings, not JSON. Importantly, condition messages must be stable - they should not include request-specific details that change on every attempt. This is because controllers watch for status changes. If a condition message includes changing details (like RequestIDs), it triggers unnecessary reconciliation loops.
For example, in this case a request ID is tracked, the condition message will change and reconcillation will be retriggered (creating a ‘tight-loop’ and lots of noise / performance issues):
r.setCondition(&model, "Available", metav1.ConditionFalse, "ModelProbeFailed",
    error) // error includes request id...
Compare to this example:
r.setCondition(&model, "Available", metav1.ConditionFalse, "ModelProbeFailed",
    error.Message) // error.Message is stable...
This will show the following line in ‘events’, which is much clearer as it shows ‘x9 over 10’ and keeps the view clean:
Warning ModelProbeFailed 64s (x9 over 10m) model-controller The security token included in the request is invalid. (403)The full details of the error can be stored in the logs instead.
Log Verbosity Configuration
The ARK controller supports configurable log verbosity levels (0-3, default 0):
- Level 0: Production monitoring - only query/model resolution events
- Level 1: Standard operations - includes all agent/team execution
- Level 2: Detailed debugging - adds LLM call tracking
- Level 3: Full debugging - includes response content
Configure via ZAPLOGLEVEL environment variable, --zap-log-level argument, or Helm chart logLevel value.