Langfuse Service
Langfuse (docs , repo ) provides comprehensive observability for AI applications, offering detailed tracing, monitoring, and analytics for your ARK agents and teams. This guide covers setting up and using Langfuse with ARK.
Langfuse is open source, integrates with popular agent frameworks through OpenTelemetry, offers public APIs for all features, and can be self-hosted.
Overview
Langfuse integration with ARK provides:
- LLM Call Tracing - Track all model interactions and API calls
- Cost Monitoring - Monitor API usage and associated costs
- Performance Analytics - Response times, throughput, and latency metrics
- Session Management - Group related interactions and conversations
- Error Tracking - Identify and debug issues in agent workflows
Note: Compatible with Langfuse versions 2.x and later.
Quick Start
Installation
Using DevSpace (Recommended for Development):
cd marketplace/services/langfuse
devspace deployNote: DevSpace automatically restarts the ARK controller after deployment to ensure it picks up the new Langfuse configuration.
Using Helm:
cd marketplace/services/langfuse
helm repo add langfuse https://langfuse.github.io/langfuse-k8s
helm dependency update chart/
helm install langfuse ./chart -n telemetry --create-namespace \
  --set demo.project.publicKey=lf_pk_1234567890 \
  --set demo.project.secretKey=lf_sk_1234567890
Access Dashboard
Credentials:
- Username:
ark@ark.com - Password:
password123
With DevSpace:
cd marketplace/services/langfuse
devspace dev
# Then port-forward to access dashboard:
kubectl port-forward -n telemetry svc/langfuse-web 3000:3000
# Open http://localhost:3000
With kubectl:
kubectl port-forward -n telemetry svc/langfuse-web 3000:3000
# Open http://localhost:3000
With Gateway API:
# Access via nip.io DNS pattern
open http://langfuse.telemetry.127.0.0.1.nip.io:8080
Configuration
Default Configuration
Langfuse is deployed with these defaults:
- Namespace:
telemetry - Service Name:
langfuse-web - Port:
3000 - OTEL Endpoint:
http://langfuse-web.telemetry.svc.cluster.local:3000/api/public/otel - Public Key:
lf_pk_1234567890 - Secret Key:
lf_sk_1234567890
OTEL Environment Variables
Langfuse automatically creates Kubernetes secrets with OTEL environment variables in configured namespaces (default: ark-system and default).
The secret otel-environment-variables contains:
OTEL_EXPORTER_OTLP_ENDPOINT: http://langfuse-web.telemetry.svc.cluster.local:3000/api/public/otel
OTEL_EXPORTER_OTLP_HEADERS: Authorization=Basic <base64-encoded-credentials>
Using OTEL Secrets in Deployments
Add to your deployment’s container spec:
envFrom:
  - secretRef:
      name: otel-environment-variables
optional: trueNote: When using DevSpace, the ARK controller is automatically restarted after Langfuse deployment. For manual deployments, existing deployments must be restarted to pick up new/updated secrets:
# Only needed for manual deployments (not DevSpace)
kubectl rollout restart deployment/ark-controller -n ark-system
Custom Configuration
Customize Langfuse by modifying chart/values.yaml:
# Enable HTTPRoute for Gateway API routing
httpRoute:
  enabled: true
  hostnames:
    - "langfuse.example.com"

# Add OTEL secrets to additional namespaces
otelEnvironmentVariableSecrets:
  enabled: true
  namespaces:
    - ark-system
    - default
    - my-custom-namespace

# Configure Langfuse settings
demo:
  project:
    publicKey: lf_pk_custom_key
    secretKey: lf_sk_custom_key
Using Langfuse Dashboard
Dashboard Overview
Once logged in, the Langfuse dashboard provides:
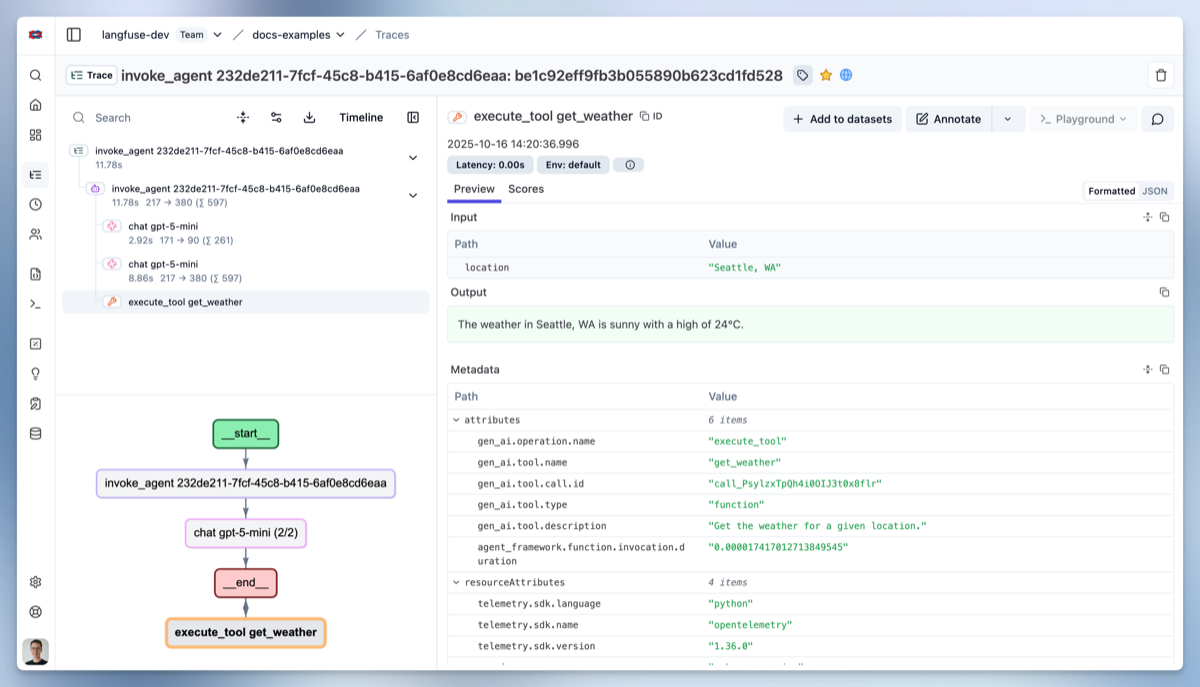
Traces View
- Complete execution traces for ARK controller operations
- Model calls and responses
- Timing and performance metrics
Sessions View
- Grouped interactions and conversations
- Session-level analytics
Models View
- Model usage statistics
- Cost breakdown by model
- Performance comparisons
Viewing ARK Traces
After installation, you should immediately see a ‘startup’ trace from the ARK controller. This confirms that telemetry is working correctly.
Traces include:
- Controller startup events
- Query execution flows
- Model interactions
- Tool executions
Troubleshooting
Langfuse Service Issues
# Check Langfuse pod status
kubectl get pods -l app=langfuse -n telemetry

# View Langfuse logs
kubectl logs -l app=langfuse -n telemetry

# Check service connectivity
kubectl exec -it <ark-controller-pod> -- curl http://langfuse-web.telemetry.svc.cluster.local:3000/health
OTEL Configuration Issues
# Check OTEL environment variables
kubectl get secret otel-environment-variables -n ark-system -o yaml

# Check telemetry initialization logs
kubectl logs deployment/ark-controller -n ark-system | grep telemetry
Dashboard Access Issues
# Check if Langfuse is ready
kubectl get deployment langfuse-web -n telemetry

# Test direct port-forward access
kubectl port-forward service/langfuse-web 5264:3000 -n telemetry

# Check Gateway API configuration
kubectl get httproute langfuse-telemetry -n telemetry -o yaml
Uninstallation
Using DevSpace:
cd marketplace/services/langfuse
devspace purge
Using Helm:
helm uninstall langfuse -n telemetry
kubectl delete namespace telemetry  # Optional: remove namespace